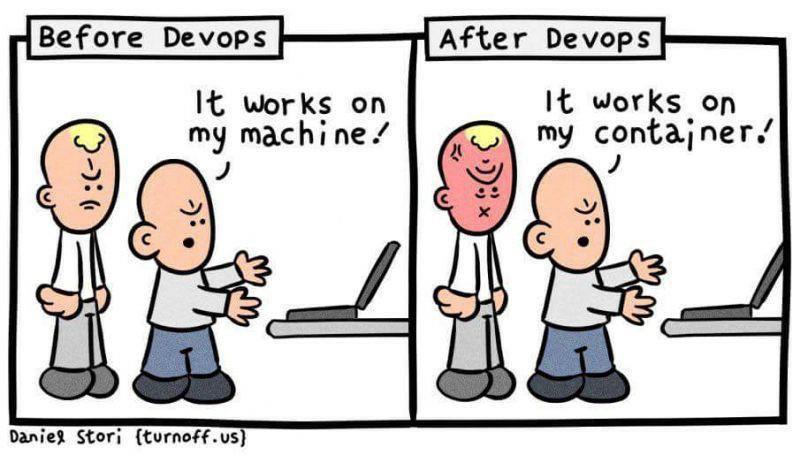
If you`ve ever worked with developers, you probably heard “...but it works on my machine” at least once. Despite being a classic programmer joke, this also hides a powerful insight.
As software engineers, we spend a lot of time looking at code in highly controlled environments, and not enough time observing it in the real world. This is where observability comes in as a way to build software that can withstand unpredictability and real-life scenarios encountered by real users.
The paradigm shift in software development
Observability refers to how easily you can assess an application`s internal state based on its external outputs, such as logs, metrics, and traces. For a comprehensive overview of what observability is, make sure to also check out “What is observability in custom software development?”
The increasing need for data observability
Observability can also be understood as a reaction to increasingly complex and distributed systems. Every container, microservice, and cloud component generates huge amounts of activity data. Observability, therefore, emerges as a way for IT teams to understand what's happening across all these environments and technologies by leveraging the dynamic nature of this data. This marks a departure from traditional monitoring, where the focus is on predefined patterns and properties.
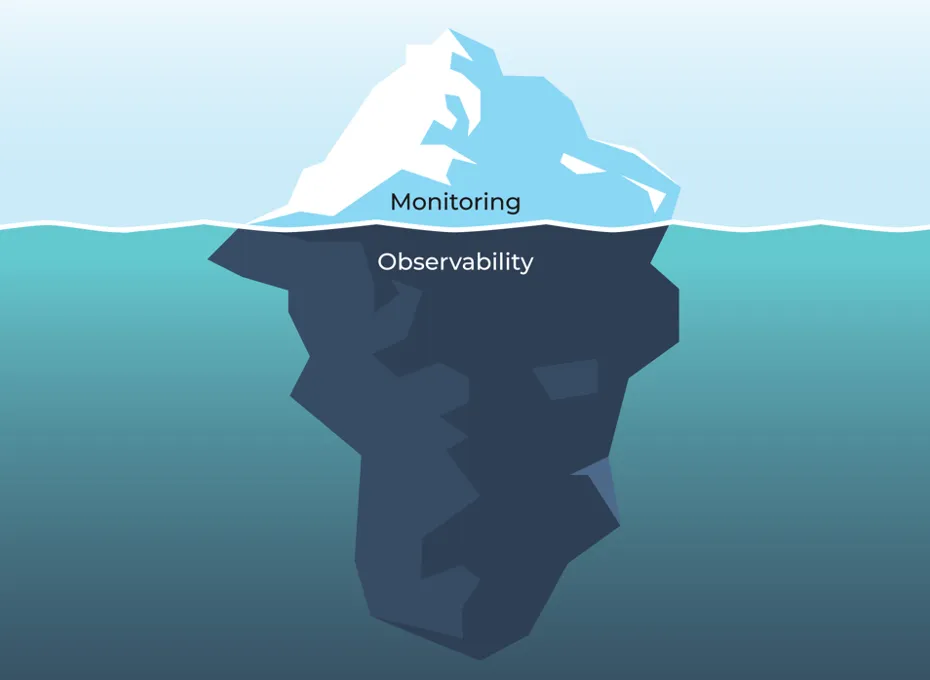
Working with the unpredictable. Monitoring versus observability
Complexity is soaring, but most of our tools were designed with a predictable world in mind. The difference between monitoring and observability is not only in the tools but also in how engineers work with them to detect and troubleshoot issues in an unpredictable environment.
Monitoring
Monitoring works by gathering predetermined sets of metrics from individual systems. If an engineer wants to identify an issue in a log, they have to know what they are looking for. Similarly, dashboards used for monitoring performance metrics and usage are preconfigured, which means:
a.) engineers need to know exactly what issues they will face in order to configure alerts, and b.) drilling down on an issue to find answers is more difficult because pre-aggregated metrics don`t support high cardinality.
Observability
In comparison, observability is much more dynamic and looks at the health and status of different applications and resources across the entire infrastructure. The goal of observability is to give teams a different type of insight, closer to how complex, distributed systems actually behave, i.e. when there`s no way of knowing in advance what type of issues will arise or when incidents don't have one single root cause.
While observability wouldn't be possible without monitoring, observability metrics extend far beyond the capabilities of most monitoring tools. This makes investing in an observability architecture and strategy a priority for any software development company.
Source: The three types of observability your system needs
Observability use cases in custom application development
Custom software development covers a wide range of applications tailored to specific business needs, with significant advantages over ready-made SaaS integrations. Observability is particularly valuable in this context, ensuring that custom software meets business and end-user requirements, while also performing at its best. Here are some of the most common use cases observability facilitates:
Application performance monitoring and optimization
By collecting and aggregating data across all systems, observability offers a broader view of a custom application`s health and performance, including issues that arise from microservices and cloud-native environments. This gives engineers better insight into problems, allowing them to identify latency issues or improper resource allocation and optimize performance.
Application security and compliance monitoring
Observability can help detect potential security threats and vulnerabilities in custom software. By monitoring logs and metrics related to security events, developers can proactively identify suspicious activities and secure software against threats. Additionally, observability helps ensure that the software remains compliant with relevant regulations and standards.
Continuous Integration and Deployment (CI/CD)
Observability practices can be used throughout the development lifecycle to ensure end-to-end visibility. By integrating these practices into the CI/CD pipeline, teams can monitor everything from the build process, test executions, and commits to pre-deployment and post-deployment checks. Setting up real-time monitoring during the CI/CD process reduces the risk of deploying faulty code to production.
Observability in a microservices architecture
In a microservices environment, the number of services and interactions between them can grow exponentially, making it challenging to track and understand the overall system behavior. This makes observability crucial for microservices architectures as it allows engineers to get a granular insight by leveraging service meshes and distributed tracing.
Observability in cloud-native environments
Cloud-native environments, characterized by containerization, orchestration, and dynamic scaling, have transformed the way applications are developed and deployed. Observability plays a critical role in managing and understanding the behavior of applications in such dynamic ecosystems, both through platform-specific observability features and through integrating third-party observability tools.
How to develop highly observable software. Implementing an observability strategy
Observability is not just a matter of using the right tools. In order to turn raw data into meaningful insights, software development teams need to intentionally design and code systems with a clear focus on observability.
Observability-driven development (ODD) extends the concept of observability to the entire process of building software, right down to the initial stages. Before looking into building an observability system, you first need to consider how to make the system itself observable. Transparent SDLC implies that applications should expose all their events in an open and intelligible manner. This includes several steps.
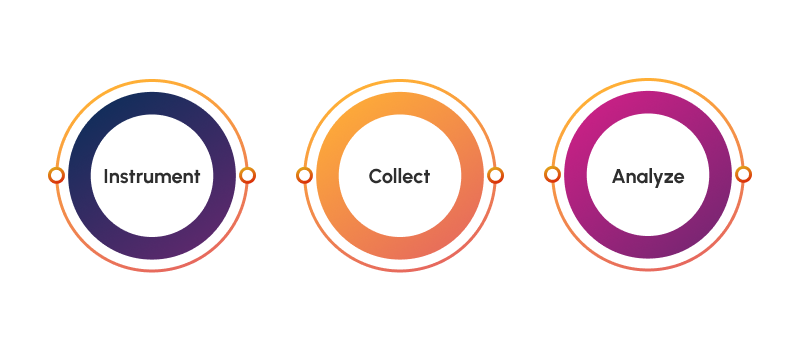
Instrumenting your code for observability
Observability starts in the development phase by instrumenting your code to capture relevant data and events. This means integrating observability tools and libraries into the application code to capture relevant metrics, logs, and traces.
When planning to observe an application, consider what data is important for that application`s health, reliability, and user experience and prioritize the most likely failure modes of the system. Depending on the tech stack you use, you can leverage your framework`s built-in support to instrument your code automatically and make this process less error-prone. Ensure that the instrumentation is lightweight and doesn't introduce significant overhead.
Collecting observability data
The data you instrument for is captured in traces, metrics, and logs, also considered the three pillars of observability.
-
Logs: historical records of events, including system and server logs, network system logs, application logs
-
Metrics: measurement of a specific activity over an interval of time, such as CPU and memory usage, infrastructure metrics, or user and web tracking scripts
-
Distributed traces: records of service calls corresponding to a request, used mostly to track microservice performance
In order for the system to be truly observable, data collection needs to cover the entire stack, including the data layer, container layer, and upper cloud application layers. Data quality is also an essential part of an observability strategy. Data should be accurate, consistent, timely, and complete in order to support correct decision-making. To ensure the quality of collected data, data sources of different monitoring systems need to be standardized to prevent duplicates, clutter and reduce noise. Periodically auditing and pruning what you monitor also helps keep this in check, for example by deleting unused dashboards, alerts, or logging.
Analyzing observability data
Observability allows unified analysis across all systems and layers. This makes interpreting health and performance data both easier and more challenging. The challenge arises not only from the amount of generated data but also from the tendency to overestimate the team's ability to constantly observe and act upon these insights.
This is why it's important to condense information into a readable and shareable format. Tools like Kibana or Grafana can help engineers build visual representations of the data and share it across teams and team members a lot easier. This also helps foster a culture of knowledge sharing between development, operations, and support teams.
When analyzing observability data, it's also important to take into account user experience insights. Understanding how users interact with the application in the real world can enrich your observability strategy. It can also give you clues regarding application performance that you might otherwise miss just by looking at raw telemetry data from back-end applications.
Building an observability infrastructure
Integrating observability into the software development lifecycle requires both a solid implementation strategy and an adequate infrastructure. When it comes to observability systems, the range of available options is quite large.
Choosing a system fit for your needs
You have a range of options when selecting an observability system. You can purchase everything from a vendor and send all your data to a third party, or use multiple tools in combination to create a comprehensive infrastructure.
Observability tools are specialized in monitoring particular aspects of applications, infrastructure, or networks. Popular options include Prometheus for metrics monitoring, Jaeger for distributed tracing, and Sentry for error tracking.
In comparison, observability platforms are comprehensive solutions that bring together multiple observability tools into a unified environment, such as Google Cloud`s operations suite.
Ultimately, the decision to use one or the other depends on your monitoring requirements and the complexity of your ecosystem.
Observability best practices in software product development
Strategy and infrastructure can only get you so far in the absence of good observability practices. In order to build an observability culture and make your software truly resilient, there are certain aspects to take into account. Here are a few ways you can make observability actionable and sustainable for your team.
1. Embed observability in your SDLC right from the start
Don`t wait until your application is in production to start observing it and tracking issues. Designing for observability means making your code transparent right from the start and embedding these practices throughout the entire software development lifecycle(SDLC), from development and testing to deployment. By integrating observability into the architecture and choosing technologies that support instrumentation, engineering teams can start collecting essential data points early on.
2. Align observability goals with business goals
Observability is not data collection for the sake of data collection. The goal of observability is to keep systems healthy and reliable, so they can achieve their business goals. Whether your goal is to increase user satisfaction and retention, cut down on operational costs or deliver new features faster, you can leverage observability practices to optimize application performance, distribute resources better and get to market faster.
3. Monitor what matters and iterate to keep metrics meaningful
Tools and platforms generate a lot of data, but not all of it might be useful to your application. In order to enable faster analysis and better insight, it's important to:
-
set clear goals regarding what you monitor
-
set appropriate thresholds for alerts
-
customize dashboards to display only relevant data
-
store logs that provide insight into critical events
To ensure you keep observing what really matters, it's essential to treat observability as an iterative process. Regularly review the collected metrics to check their relevance and usefulness and remove or modify metrics that no longer provide actionable insights. Use tracing, logs, user-centric data, and team feedback to gain valuable context and use this to adjust metrics.
4. Automate and standardize as much as possible
To prevent errors and omissions, manual intervention should be avoided when possible. Machine learning algorithms and AI can help automate or assist in observability-related tasks such as anomaly detection, log analysis, or root cause analysis. Although some of these capabilities are still in their early stages, they can provide good support in sifting through huge amounts of data or responding to incidents more efficiently.
Standardized data formats can also significantly improve observability. Creating a standardized logging format means data can be easily ingested and parsed. Similarly, standardizing what contextual information is provided, like commit IDs or deployment timestamps, can reduce the time needed to correlate issues with specific code changes.
5. Don`t forget who you`re doing all this for - the end user
Incorporating user insights into observability practices might seem like adding another layer on top of an already generous amount of data. However, adding the user perspective in the mix can not only complement telemetry data, but it can also help IT teams prepare for real-life scenarios. Gaining better visibility on how users interact with the application through user monitoring or session recordings can help engineers be aware of performance issues and potential business impact.
Observability: The key to software transparency and developer accountability
Observability is the first step towards high-performing teams and providing quality custom software development services. Without it, developers must resort to guessing and pattern matching, struggling to connect cause and effect in a timely manner.
By implementing robust observability practices, software development teams gain visibility into the inner workings of their systems, which fosters a culture of transparency and accountability.
Observability empowers developers by giving them access to critical data and insights. Armed with this information, developers can take ownership of their code and become accountable for its performance and reliability.