Observability is a must-have for building resilient applications. It gives engineering teams better insight into the performance, health, and behavior of the system, allowing for faster troubleshooting based on real-time feedback.
An important part of implementing observability is choosing the right tools. Without a proper observability infrastructure in place, your application could face downtime or significant disruptions leading to a bad customer experience and lost revenue.
So where do you begin in building your observability infrastructure?
We’ve created this practical guide to help you understand the various types of observability tools and platforms, their benefits, use cases, and how you can successfully implement them in your software development processes.
The importance of observability tools in development
With the growing popularity of observability-driven development (ODD), teams are looking at new ways to leverage observability tools from the earliest stages of development.
While observability has been a core concern for Ops and System Reliability Engineers (SRE) for some time, developers are also beginning to use such practices to solve code-related problems.
How developers use observability tools
Conventionally, operations teams use observability tools to keep applications running smoothly. They look at logs, metrics, and traces, and monitor application and infrastructure performance to detect any potential anomalies or threats.
In comparison, developers employ observability tools for different reasons, such as:
-
Detecting and optimizing problematic code
-
Gaining better visibility into API behavior
-
Understanding how code changes can affect the application’s pre-deployment and post-deployment behavior
-
Proactively testing potential issues and validating dependent relationships between components
The observability-driven development paradigm shift
By shifting the concern for system visibility into development, ODD focuses on designing applications that are easy to monitor and diagnose from the start.
This means using observability tools throughout the entire development lifecycle to:
-
Increase system reliability before, during, and after deployment
-
Improve collaboration and workflows between development and operations teams as they identify and fix issues
-
Make predictions and plan accordingly in development, including predicting anomalies, components in the application that are likely to fail, and future resource needs.
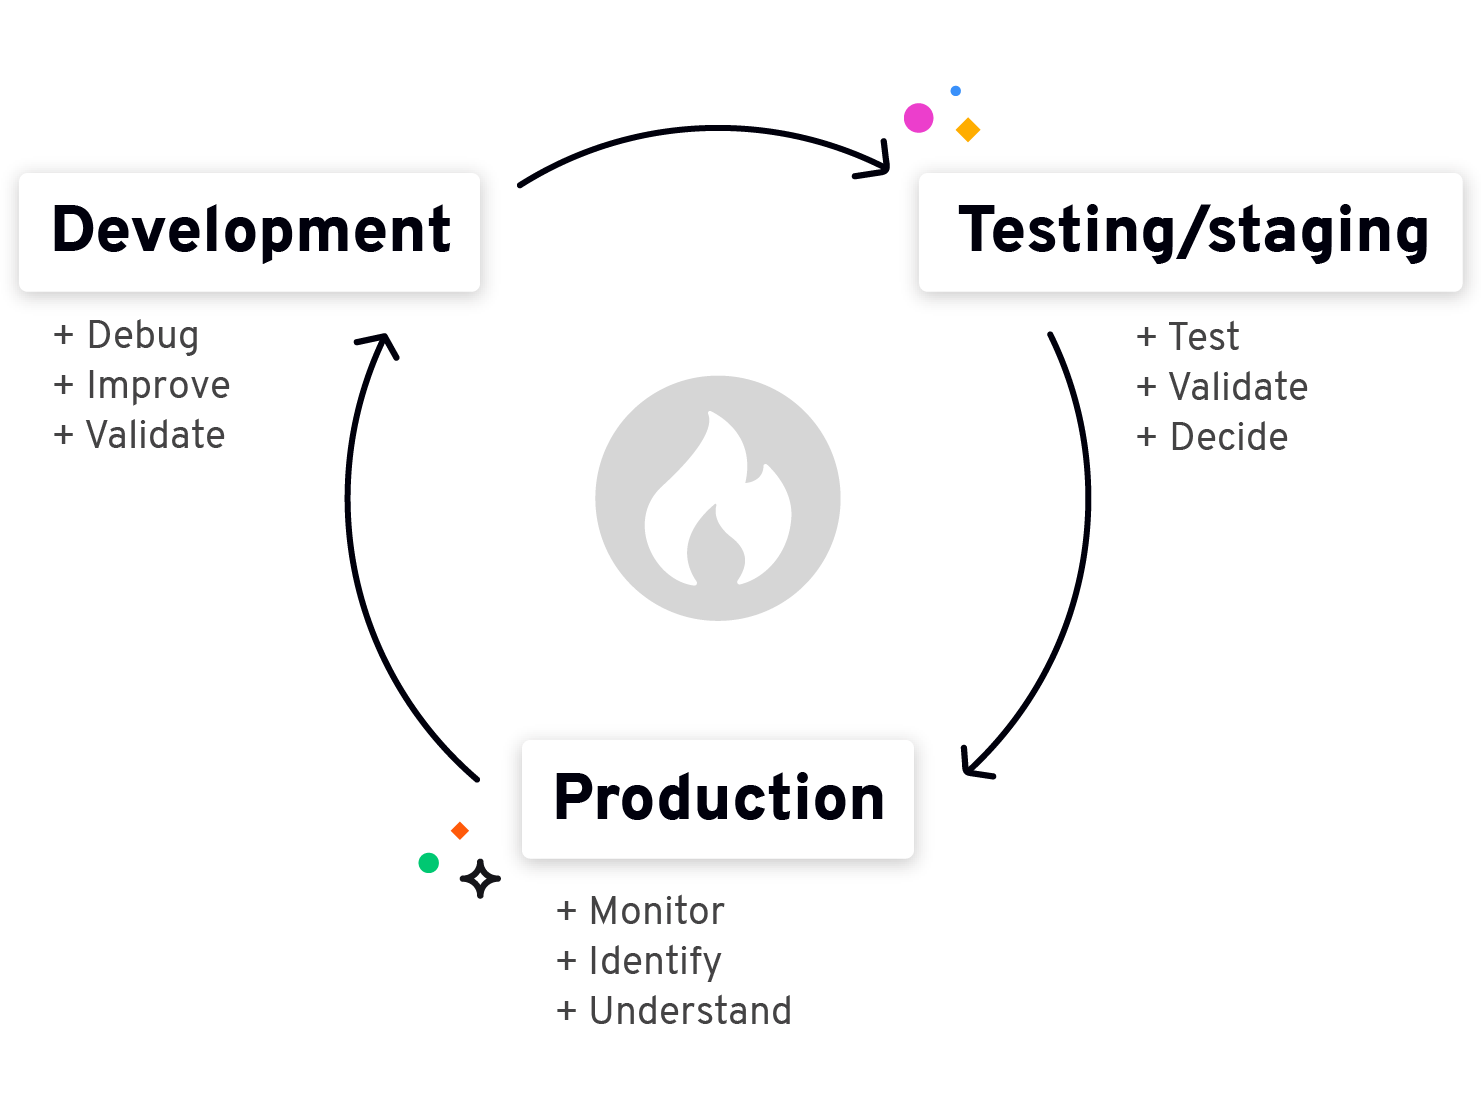
Source: platform.sh
Types of observability solutions
The toolkit you build needs to align with your observability needs, the complexity of your architecture, and your budget. A host of solutions are designed to aid ODD, although the differences between them are not always clear.
Let’s first explore some of these distinctions.
Single-point tools versus observability platforms
Single-point tools are designed to look at one specific aspect of the system or a certain part of the application. Traditionally, monitoring looks at three types of telemetry data:
-
Metrics - metrics tools collect quantitative data to track how resources are being used or how long it takes for the system to respond.
-
Logs - logging tools capture events, errors, warnings, and informational messages generated by the system to help with troubleshooting, auditing, and debugging.
-
Traces - distributed tracing tools map the flow of requests and transactions to identify bottlenecks, dependencies, and latency issues.
However, modern systems are growing increasingly complex. They include millions of lines of code and hundreds of interconnected components run in containerized environments and across several cloud services. Engineering teams often need to use multiple tools to conduct comprehensive monitoring.
With the rise of observability platforms, this telemetric data is collected and aggregated into a single source of truth. Such platforms bring together multiple observability capabilities to give a complete picture of the system’s state.
Understanding the difference between application observability and data observability
Another distinction that needs to be made regarding observability technologies is between application and data observability.
Application observability tools help DevOps avoid downtime and provide developers with valuable insights to understand, debug, and optimize software systems. Common use cases include incident management, root cause analysis, and incident resolution.
In comparison, data observability tools monitor a few things. They access data tables to assess data volumes, schemas, and distribution, and provide Data Engineers with a better idea of the quality and trust levels of the data.
Features to consider in application observability solutions
Application observability tools and platforms come with various capabilities. When weighing your options, it’s important to take a look at the features you need to gain better visibility into performance and infrastructure.
Centralized dashboards and visualizations
Observability relies on being able to interpret information coming from the application in real time. Centralized dashboards and visualization options cut down on the effort of browsing huge quantities of data to gather insights and make correlations.
Alerting and notifications
As a software engineer, you want to be notified of critical issues as soon as possible without becoming lost in the noise. Application observability tools need to support complex alerting logic, where you can set rules and thresholds for when notifications should be sent.
Automated anomaly detection
Having an infrastructure that allows for anomaly detection is essential if you have a complex architecture and data coming from multiple sources. Observability tools use Machine Learning algorithms to automatically identify and alert on abnormal behavior.
Automated service instrumentation
Instrumenting services to reveal the required logs, traces, and metrics can be time-consuming and need advanced configuration. Consider looking into tools that automate this process and make your observability infrastructure easier to set up and maintain.
Traceability across services
If your applications are distributed or use microservices, ensure your tools of choice offer distributed tracing capabilities to track requests across services. Trace visualization allows you to track the entire request journey and pinpoint where failures occur.
Popular observability tools & platforms
A number of vendors offer observability solutions, ranging from Application Performance Management (APM) software to distributed tracing, log analytics, and visualizations.
Full-stack observability platforms like AppDynamics, Datadog, Dynatrace, and New Relic provide end-to-end APM monitoring across infrastructure and applications, with some also supporting databases and network monitoring. These platforms allow a wide range of data sources, as well as integration with container orchestration systems.
Most of these solutions cater to enterprise architectures, so depending on the size and complexity of your system, you might also want to look into open-source alternatives like Prometheus, Jaeger, OpenTelemetry, or OpenSearch.
Log analytics and management is another category of tools engineering teams use to collect, centralize, and query log data. Solutions like Loggly and Sumo Logic provide advanced log analysis, alerting, and visualization features.
In terms of data visualization, Grafana is a dashboarding tool that integrates seamlessly with various sources. It can even access Raspberry Pi devices and services such as Google Sheets, to create informative, customizable dashboards.
Last but not least, it’s worth noting that cloud providers such as AWS, Google Cloud, and Azure also offer built-in observability services, with AWS CloudWatch and Google Cloud Monitoring being two examples of cloud-native observability tools.
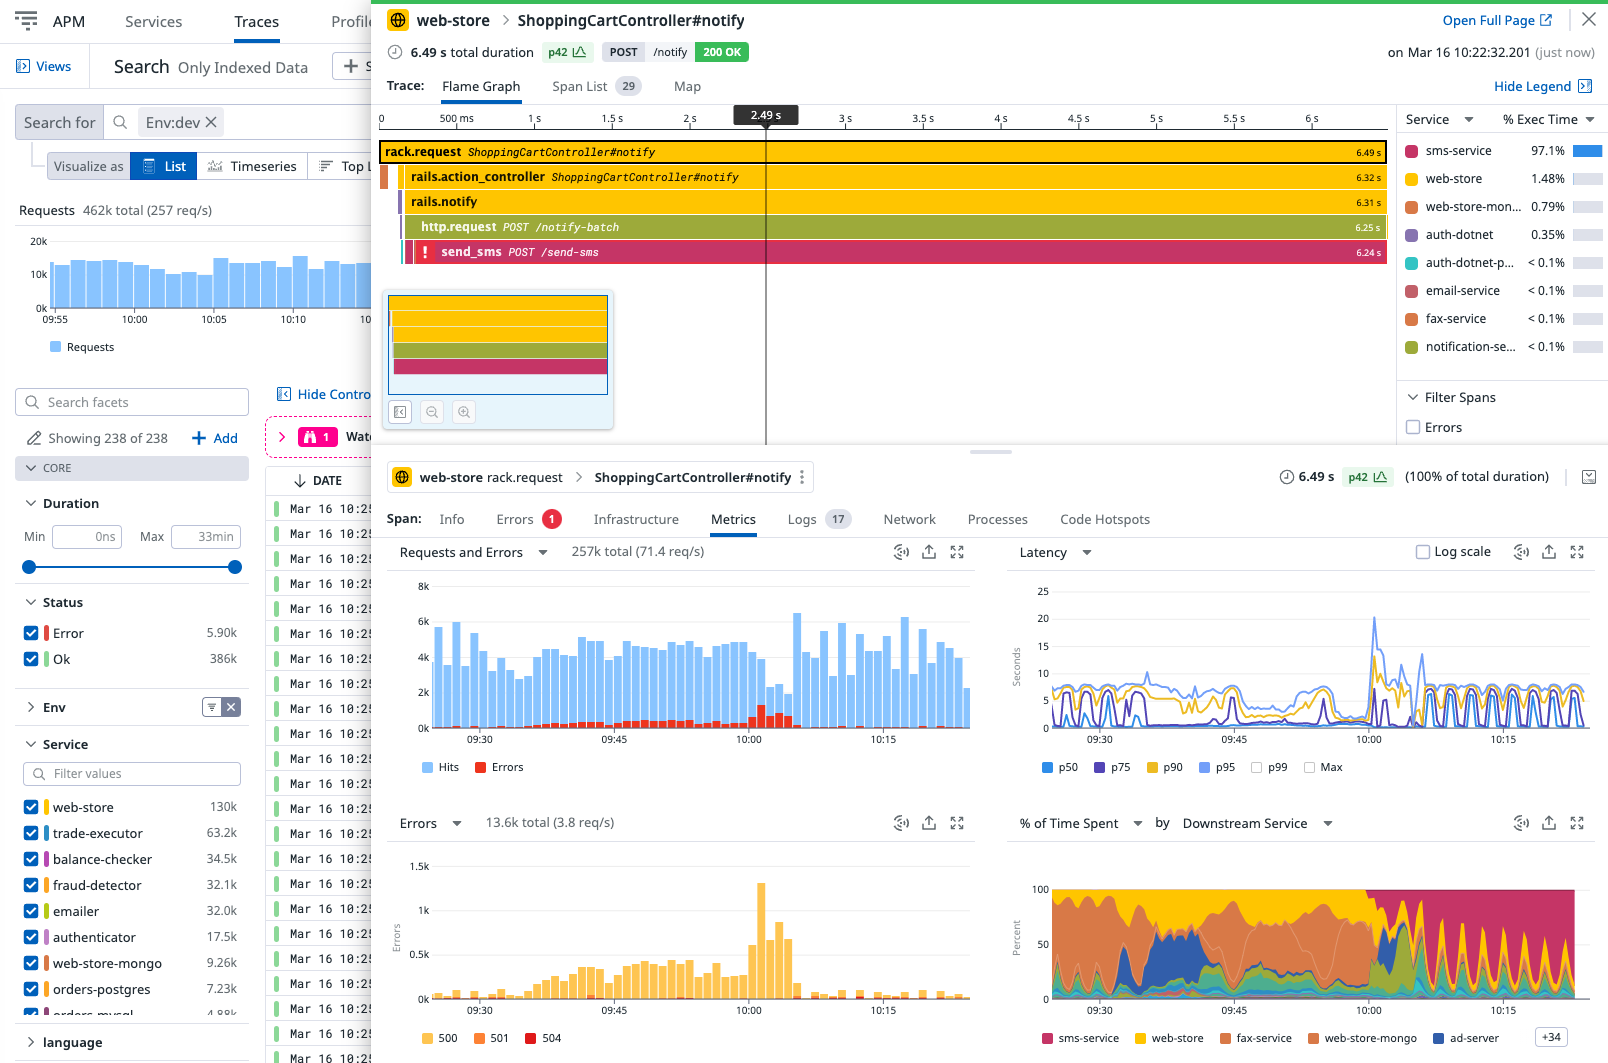
Source: docs.dapr.io
Use cases and benefits for businesses and engineering teams
Application observability and the tools that make it possible open up a new way of looking at software development and maintenance. This goes beyond just firefighting issues to proactively enhancing performance and continuously improving the system based on data.
Improving customer experience
Observability solutions can provide valuable insights into those areas that need to be optimized for a better user experience.
As development teams work to deliver CX innovations, from VR shopping experiences to AI-powered products, customer experience observability emerges as an important factor in keeping these technologies reliable and easy to use.
Optimizing cost and performance
System failures are costly, from the energy spent finding the root cause of an incident to a damaged brand reputation. With a solid observability infrastructure, organizations can cut down on these costs.
They can also predict storage and computing resource needs more accurately and eliminate wasteful spending.
Enhancing modern application security
When security and IT teams are not aligned it’s a lot harder to defend systems against attacks. Full-stack observability tools provide common ground by integrating run-time application security more effectively into CI/CD pipelines both in development and production environments.
By combining observability-driven development and security, engineering teams can improve their ability to react to exploits and threats.
Gaining better control over complex systems
Cloud-native technologies and distributed infrastructures like microservices and containerized components are becoming the norm. These stacks come with new challenges, from the massive amounts of data they generate to the increased complexity of managing them.
Observability helps engineering teams cut through the noise in order to understand how performance issues are impacting key metrics.
How leading companies use observability solutions
Puma detects order issues in minutes leading to $10k per hour in boosted revenue
With a long history of selling sports apparel, Puma owns over 45 e-commerce websites. Failed orders can be a challenge for any e-commerce vendor, leading to unhappy customers and missed sales opportunities.
Puma used an application observability solution to cut down on the time needed to identify and fix order issues. Quicker incident investigation allowed the company to decrease response time to 15 minutes and boost revenue to $10k per hour.
Kmart Australia ensures 99.9% uptime through Application Performance Monitoring
Kmart Australia is one of the biggest chains of retail department stores in the country. As part of their digital transformation, they implemented an APM observability solution that allowed them better visibility and control over their infrastructure and systems.
They managed to achieve a steady 99.9% uptime over the course of 6 months, increasing their ability to support peak events like Black Friday or holiday shopping.
Key steps for setting up your observability infrastructure
After you’ve decided on an observability tool or platform, you need to implement this solution and integrate it into your existing workflows. This requires careful planning in order to make the most out of your investment.
1. Get clear on metrics and data collection strategy
There are countless things you can monitor through observability, from bandwidth down to how much power cooling systems require to operate efficiently.
As a first step, it’s important to get clear on what you want to track and where this information will be coming from. Look into the various sources you plan to feed data from, such as applications, servers, databases, and network devices, and make sure your infrastructure can support it.
2. Integrate observability tools in your tech stack
To successfully implement your tools of choice, you need to instrument your applications to start generating the observability data you want to measure. This might involve using libraries or SDKs to capture relevant metrics and events, although some observability solutions support automated instrumentation.
A good observability toolkit should provide seamless integration with popular languages and frameworks, cloud providers, and container orchestration systems.
3. Define team responsibilities and workflows
Depending on the size or complexity of your software project, you will want to assign a person or a team to oversee your observability environment and make sure it operates properly. Organizations with lean teams or relatively simple architectures, often have one or two software developers who are also in charge of such tools.
As organizations and projects grow, observability tends to be delegated to specialized Observability Managers or Site Reliability Engineers.
4. Configure real-time monitoring and alerting
As a software engineer, the last thing you want to do is miss a potential incident or threat. On the other hand, having to sift through thousands of alerts, including some that might not even require a response, can lead to monitoring fatigue.
Properly configuring monitoring and alerting is a critical part of implementing observability. Set thresholds to automate the alert response whenever possible and configure your observability tools to capture data accurately.
5. Ensure your observability infrastructure is scalable
As data volumes, system complexity, and traffic increase, your observability solution should also be able to adjust accordingly. By setting up auto-scaling for your cloud infrastructure, you can automatically boost or decrease assigned resources.
You can read more in our article about how we helped a partner fintech company reduce monthly infrastructure costs by up to 50% with autoscaling.
Source: Freepik
Want to build highly observable applications?
Observability tools empower engineering teams to track system performance across the development lifecycle and build more resilient applications as a result.
Following this approach, observability becomes an integral part of writing and shipping better code and understanding what is causing problems in the first place.
At ETEAM, we’ve worked over the years with various clients to build robust infrastructures and highly observable applications. As a certified AWS Consulting Partner, we understand the challenges of making modern, distributed environments observable, and we specialize in helping companies leverage cloud technologies to build more stable, cost-effective software applications.